Mastering Cyber Threat Intelligence with Obsidian
Utilize Obsidian to transform your CTI dataset and uncover unprecedented connections
Key Takeaways
- Obsidian offers CTI analysts the ability to use a private Cyber Threat Intelligence dataset to perform live correlations and statistics at scale;
- Obsidian can be shaped to become a fast, secure, free, stable, and adaptable CTI platform;
- Create graphs and links to correlate information from your dataset, experiment with new ways to represent information, and discover intelligence relations that you hadn’t seen before;
- Tailor your CTI workflow with Obsidian’s templates, tags and multiple community plugins.
Introduction
As a CTI analyst, you frequently encounter the challenge of transitioning between different Cyber Threat Intelligence (CTI) platforms, where the data at your disposal is controlled by vendors or external parties leaving you with limited control over your own data.
To maximize your intelligence capabilities, Obsidian serves as an ideal CTI platform. It allows you to integrate data from third parties and, most importantly, leverage the intelligence you possess, gathered from incidents/events managed by your company or the entities you protect.
If you seek a free Threat Intelligence platform that operates locally, enabling you to correlate data and generate custom graphs and charts based on your data, Obsidian fits the bill. In this article, I will outline different methods for utilizing Obsidian to oversee an intelligence dataset effectively and harness its full range of features to streamline your tasks as a CTI analyst.
What is Obsidian?
Obsidian is a note-taking and knowledge management tool, and while it might not be specifically designed for Cyber Threat Intelligence, it can still be a valuable tool in this domain.
Link: https://obsidian.md/
Obsidian supports multiple platforms including Windows, Mac, Linux, Android and iOS.

Obsidian securely stores all your notes directly on your device, ensuring privacy and security. It operates independently of external servers, granting you complete control over your data. Utilizing the local vault is entirely free and allows for easy export and backup options.
Obsidian utilizes Markdown for note formatting, allowing for easy text styling, embedding of images, and creating links between notes. Additionally, you have the option to append files like PDF reports, images, or spreadsheets to notes. Moreover, you can create tables, use tags and integrate hyperlinks to external intelligence sources, reports, or additional context.
Main Obsidian Features
- Links
- Tags
- Graph View
- Canvas
- Templates
- Statistics
- Plugins
Among Obsidian’s primary features, you can utilize Links and Tags to establish connections or generate Graphs to visualize the relationships between your notes. Furthermore, you can design your Canvas and install numerous free Plugins to tailor your dataset visualization and properties.
Links
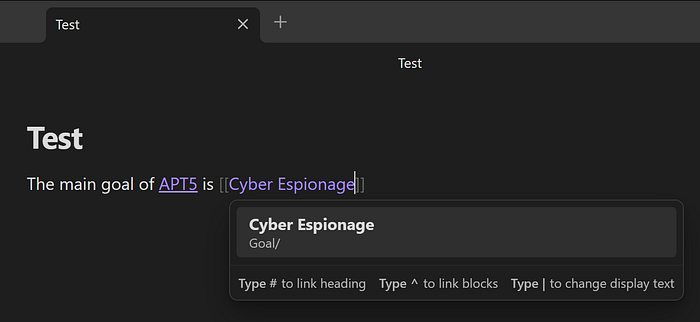
Through links, you can establish connections between one or more notes, facilitating seamless navigation and rapid access to desired information. To swiftly link a note to the one you’re presently composing, just insert the double square brackets [[, and a list of your notes will promptly appear for selection. Here’s an example:
Tags:
Leverage Obsidian’s tagging feature to organize information effectively.
Use tags to label and organize your threat intelligence notes. For example, you might use tags like #Malware, #APT, #Vulnerability, etc. This makes it easier to filter and search for specific information:

Graph View
By utilizing links, you can interconnect the various notes, enabling Obsidian’s default embedded function to automatically generate a graph featuring the linked notes. This offers immediate oversight of your threat landscape scenario highlighting for instance the most targeted sectors or the most active threat actors and the connections between them.
In other words, using the graph views in Obsidian enables you to create visual representations of relationships between different elements in the threat landscape, providing a more intuitive understanding of complex threat scenarios:

The graph provides filters that you can use to display relevant information, remove “orphan” notes without links, color-code different categories of notes, and rearrange nodes as desired, making even a complex CTI dataset comprehensible.
Canvas
Use the Cavans feature as an alternative method of graphic representation of your notes. You can insert notes into a canvas using Obsidian’s embedded feature for visual representation. This enables you to visualize connections and piece together crucial elements in extensive investigative cases:

Creating the arrows that connect the notes or creating new cards is very simple and intuitive. In few steps you will have created a diagram of an incident or an investigation that will help you connect the dots (crucial phase for those dealing with intelligence investigations).
You can also take detailed notes during threat intelligence analysis sessions, keeping track of observations, hypotheses, and potential correlations between different pieces of information.
Templates
You can use Templates to insert pre-defined snippets of text into your active note.
This feature proves highly beneficial when structuring your Obsidian vault for Cyber Threat Intelligence. It enables you to swiftly generate new notes categorized by topic, while also preventing the loss of essential fields designated for specific topics or groups of notes.
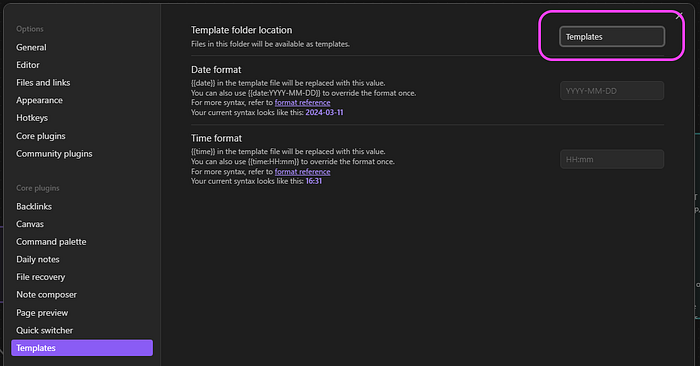
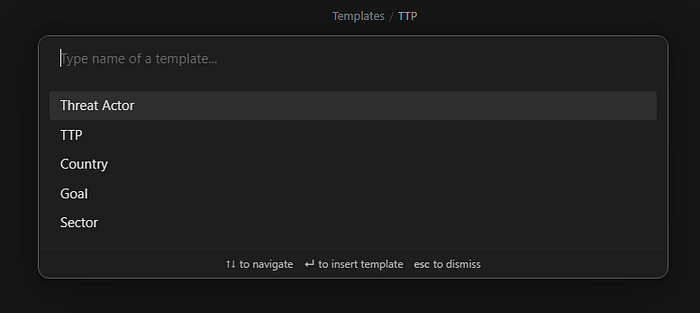
You have the option to set the template folder location, and once your templates are configured, you can choose the desired template every time you create a new note.
Statistics with Mermaid
Mermaid allows creating and rendering of different diagrams using markdown syntax.
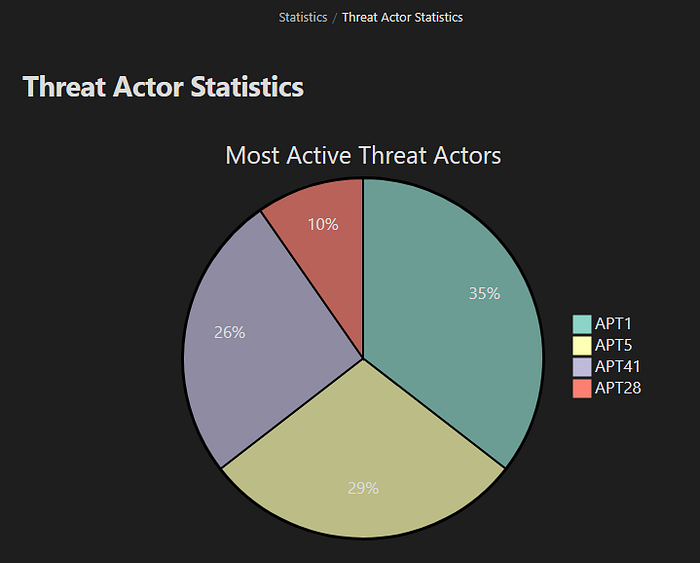
For instance, if you wish to generate statistics utilizing a pie chart, such as identifying the most active threat actors in the past year or the most targeted sectors, you can effortlessly employ the Mermaid piechart function. This feature is automatically enabled in Obsidian and can be utilized by employing the correct syntax provided below:
```mermaid
pie
title Most Active Threat Actors
"APT1": 44
"APT5": 36
"APT41": 32
"APT28": 12
```
You can access all the available diagrams at this link, which you can use to generate statistics according to your needs.
Plugins
An additional standout feature in Obsidian is the freedom to install community plugins at no cost. By simply activating them in the main menu, you gain the capability to tailor your notes and vault to suit your specific requirements.
Users can customize Obsidian to suit their specific needs and objectives. Below are several Plugins that could prove useful for Threat Intelligence:
- Dataview
- Excalidraw
- Iconize
- MarkMind
- Paste image rename
- Persistent Graph

Dataview
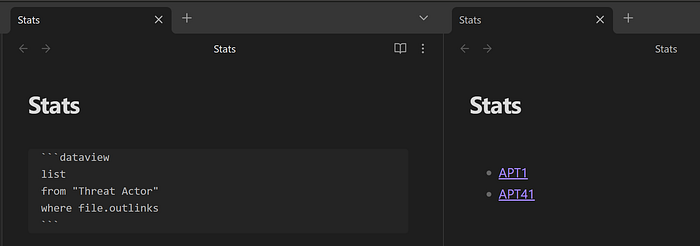
Dataview is a live index and query engine over your personal knowledge base. You can add metadata to your notes and query them with the Dataview Query Language to list, filter, sort or group your data. Dataview keeps your queries always up to date and makes data aggregation a breeze.
In the following example you can see the simple query to list the notes with Threat Actor notes containing outlinks:
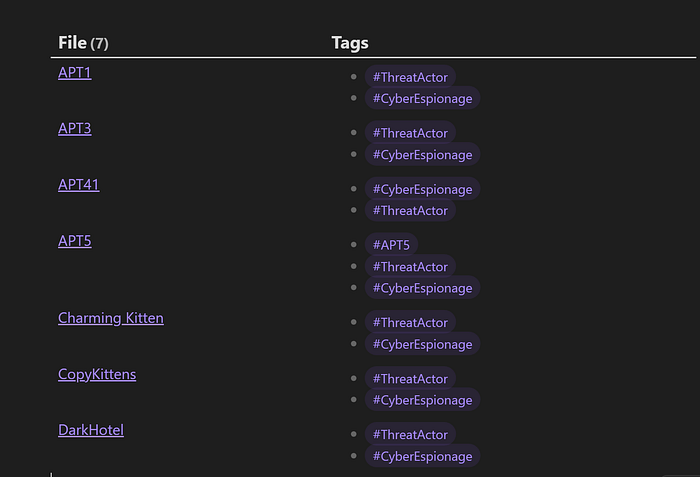
Dataview can be used to generate statistics with the data present in your vault, offering numerous options for creating tables and lists with the specific statistics you require. You can create tables counting the number of events associated with a single threat actor to keep the most active threat actors updated in real-time. Alternatively, you can compile a list of the most targeted companies or sectors. The possibilities are vast.
Following a Table example:
Excalidraw
Excalidraw is a whiteboard tool that lets you easily sketch diagrams that have a hand-drawn feel to them.


Having Excalidraw embedded in Obsidian allows you to use its features with the possibility of adding your own personal notes to the diagrams. This plugin can also be used as an alternative to the Canvas.
Iconize
Iconize enables you to incorporate any custom icon or choose an icon from a pack for anything you want.
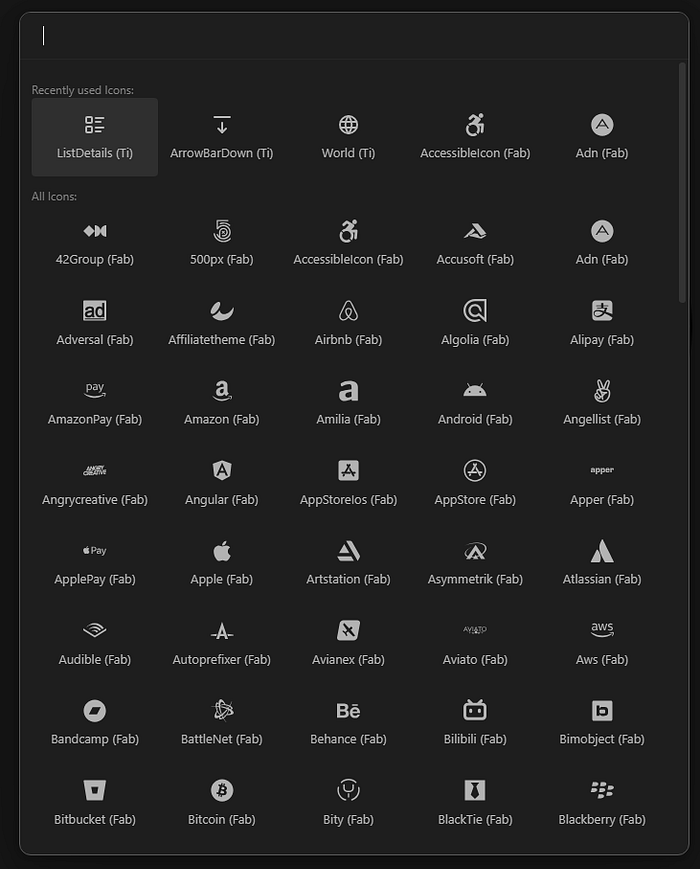
You can include visual references to your folders or files, making them easily identifiable from your Obsidian menu. With this capability, you can customize various categories, facilitating quick and effortless identification of necessary items, even amidst a large number of folders or files.
MarkMind
The MarkMind plugin for Obsidian integrates mind mapping functionalities, allowing users to visually organize and explore their notes and ideas within the Obsidian platform. It offers interactive editing, customization options, cross-linking between nodes, and integration with Obsidian’s core features.
After generating your mind map, you’re able to relocate nodes, collapse them, and explore various visualization options.
Following a Mind Map example:

Paste image rename
The paste image rename plugin shows a prompt that allows the user to rename the image, this is a great help if you want your images to be named and organized clearly.
You can set up the plugin to automatically rename the images to match the name of the note when they are inserted into it. Thus all the images will be found under the attachments folder, bearing the same names as their corresponding notes.
Following the plugin in action:

You can set up the default folder for the attachments in the Obsidian settings:

With this feature, you can effortlessly store all attachments in the “Attachment” folder, ensuring that files are organized according to the note names.
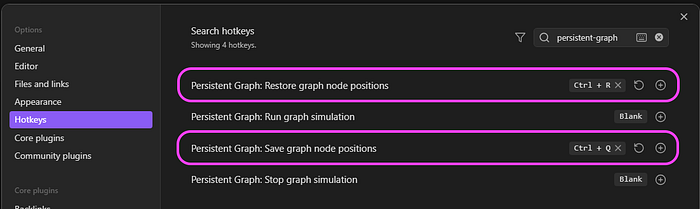
Persistent Graph
Another useful plugin is the persistent graph plugin.
Do you love using the global graph as a powerful spatial tool, but cry every time Obsidian restarts and all nodes lose their place? Would you like to retain the shape of your graph over a long time? Well then this plugin is for you.
After setting up the shortcuts for saving and restoring the graph, you can customize your views. Even if you close and reopen Obsidian, your graph will revert to its previous state, as saved the last time.
Centralized CTI Knowledge Base
Obsidian enables you to create a centralized repository for all CTI-related data, including threat actors, their main properties and TTPs, the associated IOCs and much more.
You can subsequently interlink these data with the ones related to your company or the companies you are protecting. Thanks to these interlinks you will be able to easily define the threat landscape scenario.
Let’s explore a practical example by establishing a Threat Intelligence local vault, which includes a compilation of tracked or identified Threat Actors along with their pertinent properties, all interconnected:

You have the option to compile your own roster of Threat Actors or import existing ones from sources like Malpedia, MITRE, or other security firm websites, depending on your objectives. As depicted in the image above, a vault titled “Threat_Intelligence” and a folder labeled “Threat Actor” containing numerous .md files pertaining to various APT groups and threat actors have been established.
For each Threat Actor, you can include all relevant information based on your preferences, including aliases, descriptions, objectives, targeted sectors, victims, TTPs, and additional details:

As showed the image above, various links have been established within the APT1 file. The pre-existence of sections such as Goals, TTPs, and others has streamlined the process of interconnecting these sections.
Once you’ve invested effort in constructing your dataset of Threat Actors, goals, and other sections, it becomes effortless to establish various relationships for the involved Threat Actors and visually illustrate the relationships among the various incidents and main events recorded within your company or the ones you protect.
Leverage Obsidian’s bidirectional linking features to create connections between different entities such as malware, threat actors, and specific campaigns. This can help in visualizing relationships and understanding the broader context.
In addition, archiving historical threat intelligence data, allow CTI analysts to review past incidents and identify patterns or trends that may be indicative of ongoing or future cyber threats.
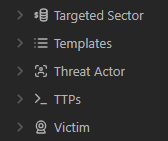
Folders’ structure
Creating a comprehensive Threat Intelligence dataset in Obsidian involves organizing your vault (notes, files, and folders) in a logical and accessible manner. Here’s a suggested structure that you can adapt based on your specific needs:

Integrations:
Explore integrations with other CTI tools or data feeds. While Obsidian may not have direct integrations, you can manually import or link relevant data from other sources.
By leveraging the Obsidian Execute Code Plugin, you can automate the generation of specific .md files containing predefined attributes that can be connected to other Threat Intelligence platforms, thereby facilitating the creation and updating of your dataset in an automated fashion.
This plugin allows you to execute code snippets in code blocks in your notes. The plugin adds a ‘run’ button for code blocks in supported languages. Clicking them results in the code of the block being executed. After the execution the result of the execution is showed.

With this integrations in place you can also create multiple vaults based on the different needs. You can have a “clean” vault with only validated intelligence and others with properties automatically updated via python script.
Conclusion
Obsidian emerges as an interesting solution for Cyber Threat Intelligence analysts seeking to optimize their intelligence capabilities. By providing a versatile platform, Obsidian empowers analysts to take control of their data and improve their investigative processes. Its local storage ensures privacy and security, while the multiple available features enhance organization and accessibility.
Through Obsidian’s intuitive interface and diverse range of plugins, analysts can tailor their CTI workflows to their specific needs, from generating statistics and diagrams to automating tasks and maintaining a centralized knowledge base. The platform’s flexibility extends to its support for various platforms allowing analysts to leverage existing tools and data feeds within their Obsidian environment.
Ultimately, Obsidian serves as more than just a note-taking tool; it evolves into a CTI platform that empowers analysts to effectively manage, analyze, and act upon threat intelligence data, enhancing their ability to detect and respond to cyber threats in a dynamic and evolving landscape. As the demand for actionable intelligence continues to grow, Obsidian stands out as a valuable ally for CTI analysts striving to stay ahead of emerging threats and protect their organizations.
